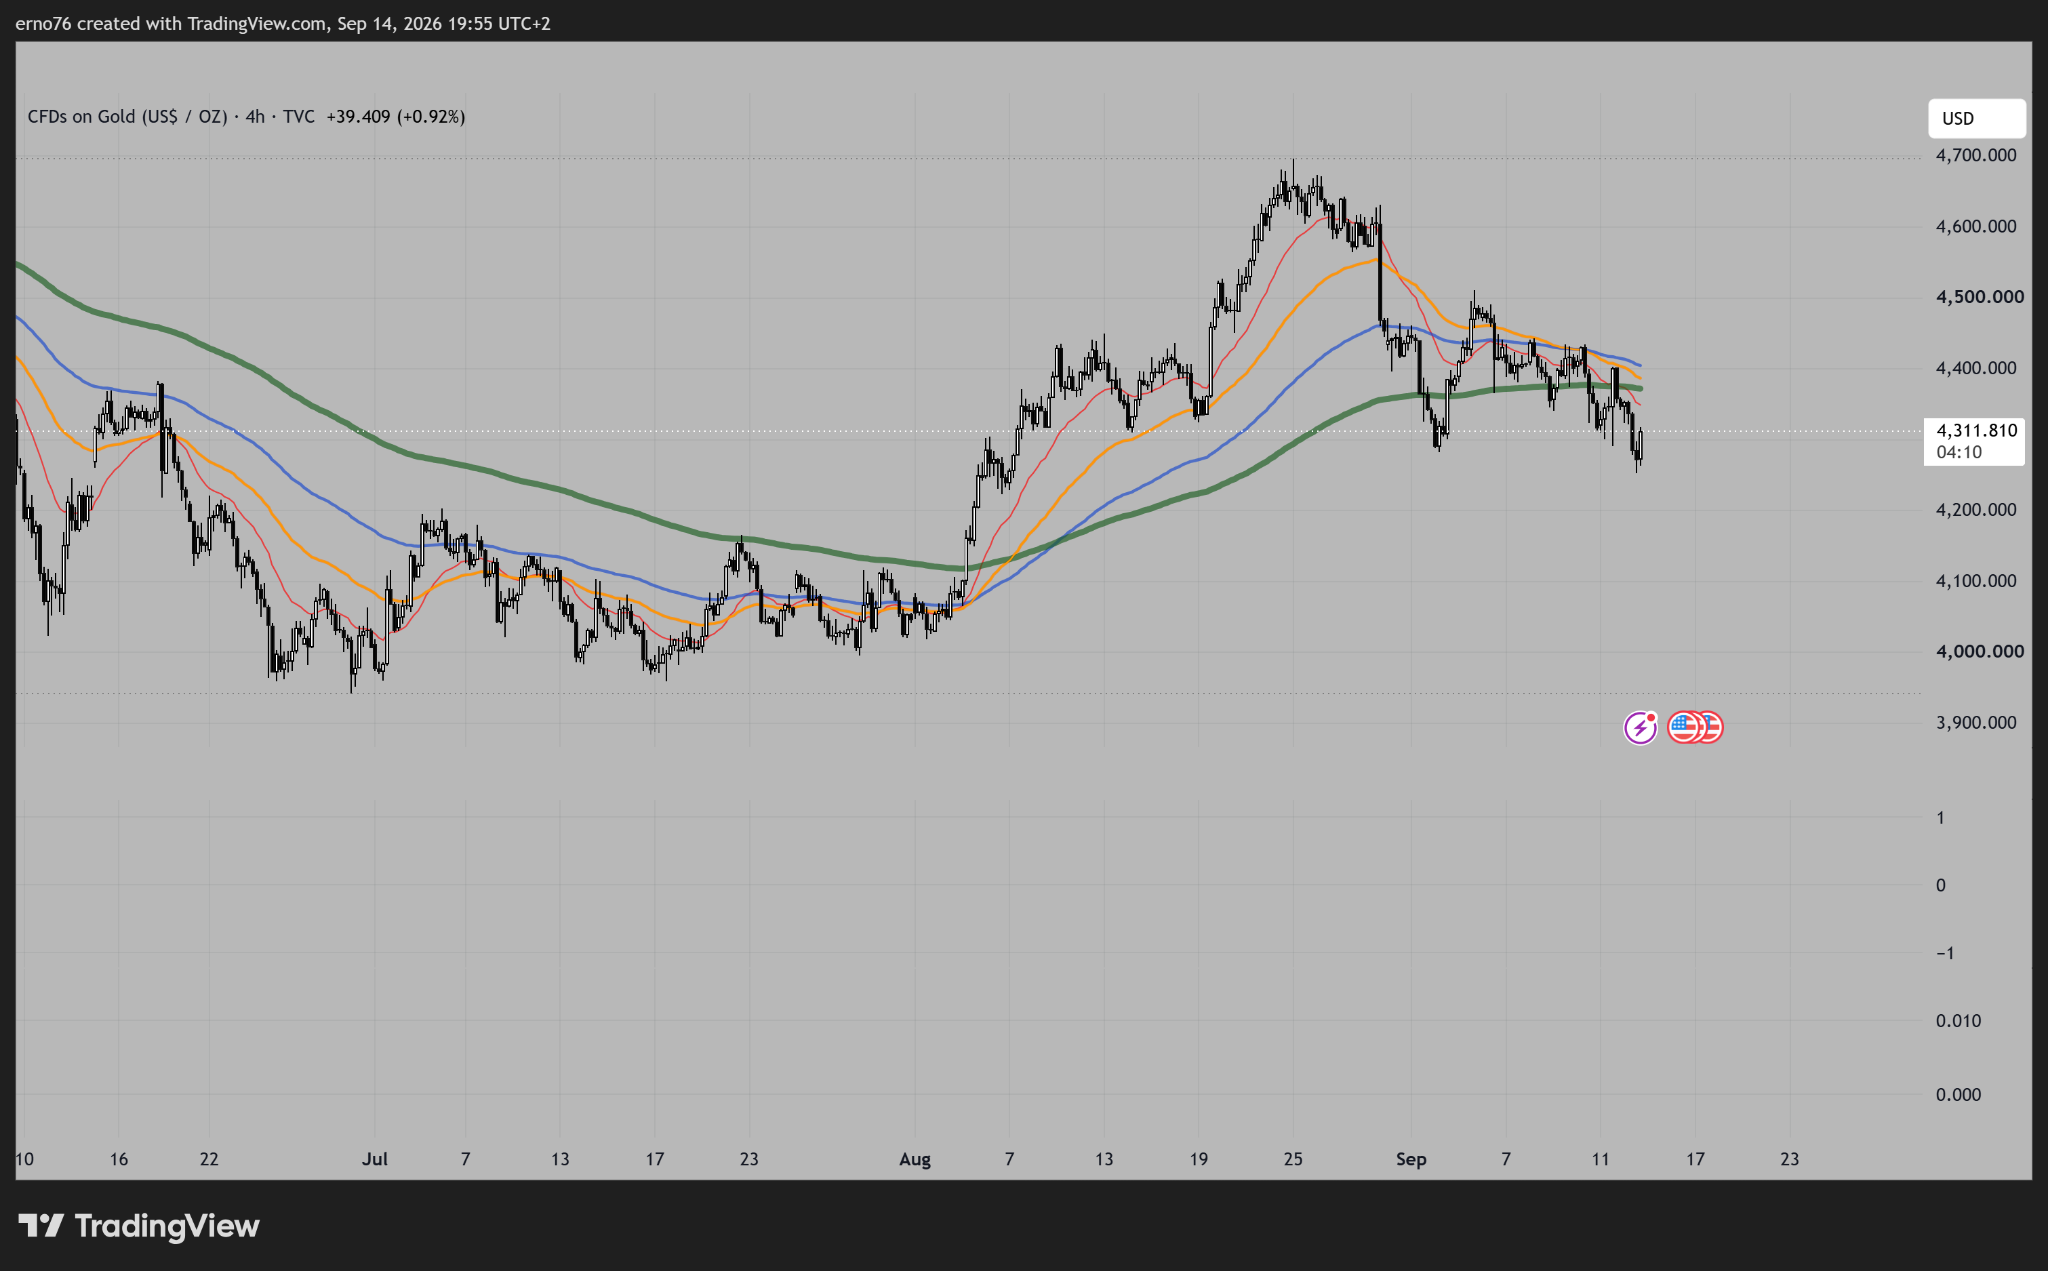
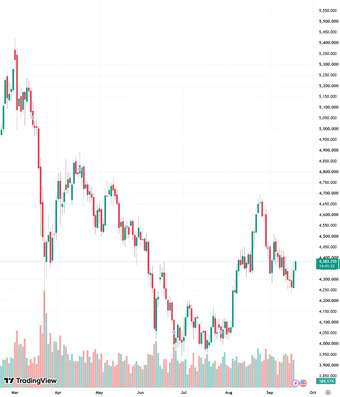
On September 16, gold found itself in an unusual position: the Fed raised interest rates for the first time in three years, hiking by 25 basis points to 3.75–4.00%, specifically to address inflationary pressure. Textbook logic would suggest tightening should weigh on precious metals – instead, gold has recovered from this week's low of $4,235 back into the $4,300–4,360 range, while still up +15.4% year-on-year. Silver has behaved even more decisively, trading at $65.93, up +53% year-on-year.
Gold's technical picture
A correction has been underway since the September 8 high of $4,443 (down -3.3% for the week, -3.2% for the month), and the price is currently trading below the 20-day EMA (≈$4,365), painting a neutral-to-slightly-negative near-term technical picture. Key levels: resistance at $4,365 and $4,443; support at this week's low of $4,235, followed by the psychological $4,000 level.
What's keeping the market afloat?
Two forces are pulling gold in opposite directions. On one hand, the Fed is clearly hawkish: 16 of 18 policymakers see at least one more hike this year, and markets are pricing in roughly 75 basis points of further tightening by next June – on its own, that would work against gold. On the other hand, falling oil prices (following news of restored Saudi pipeline capacity) have eased near-term inflation fears, supporting risk appetite and precious metals alike. The 10-year yield sits at 4.94%, near 19-year highs, though it has pulled back slightly in recent days.
Silver and the gold-silver ratio
The gold-silver ratio currently sits around 65–66 – relatively tight by historical standards, meaning silver is relatively stronger than gold. This is likely driven by a combination of industrial demand (electronics, solar manufacturing) and rising investment demand.
Possible scenarios – gold
- A) The correction continues, testing the $4,235–4,200 zone; failure there shifts focus to the psychological $4,000 level.
- B) Sideways trading in the $4,300–4,443 range until a new macro catalyst emerges (Fed speeches, inflation data).
- C) A breakout above $4,443, if the oil-driven easing of inflation expectations proves durable and Fed rhetoric softens in the coming weeks.
Possible scenarios – silver
- A) Profit-taking, with the gold-silver ratio climbing back above 68–70.
- B) Sideways trading in the $64–68 range.
- C) A further breakout attempt above $66–68 as industrial demand strengthens.
This analysis is provided for general informational and educational purposes only and does not constitute personalized investment advice or a recommendation to buy or sell. The scenarios and levels above are based on publicly available technical and macroeconomic data and should not be regarded as a forecast or guarantee. Precious metal prices can fluctuate significantly, and past performance is not indicative of future results. AGAU999 trades in physical gold and silver and therefore has a commercial interest in the development of these markets and in the sale of the products it offers. Before making any investment decision, consult your own risk tolerance and objectives, and seek independent professional advice where appropriate.